You paste your URL into PageSpeed Insights and get a number: 47/100 on mobile. Your developer says "that's just a lab test." Your marketing manager says "Google will penalise us." Both are partially right — and both are missing the full picture.
The PageSpeed score is a useful diagnostic tool, but only if you understand what it measures, what it does not measure, and how it connects to real business outcomes.
What is the PageSpeed score?
Google PageSpeed Insights (PSI) runs an automated audit of your page using Lighthouse — an open-source tool built into Chrome DevTools. It evaluates performance, accessibility, best practices, and SEO, then calculates a score from 0 to 100 for each category.
The Performance score is what most people mean when they say "PageSpeed score." It is a weighted average of several metrics, with the heaviest weight on Core Web Vitals.
90–100
Good — fast loading, minimal issues. Google considers this the target range.
50–89
Needs improvement — users experience noticeable delays. Fixable with targeted optimisation.
0–49
Poor — serious performance problems. Likely losing traffic and conversions right now.
What the score is actually measuring
The Performance score is calculated from these metrics (approximate weights as of 2026):
Largest Contentful Paint — 25%
How quickly the main content of the page becomes visible. Usually the hero image or main heading.
Target: under 2.5 seconds.
Total Blocking Time — 30%
How long the main thread is blocked by JavaScript, preventing user interaction. TBT in Lighthouse approximates INP (Interaction to Next Paint) used in real-user data.
Target: under 200ms.
Cumulative Layout Shift — 25%
How much page content jumps around while loading — buttons moving, text shifting when images appear.
Target: under 0.1.
First Contentful Paint — 10%
When the first text or image appears on screen — the moment the blank white page ends.
Target: under 1.8 seconds.
Speed Index — 10%
How quickly content is visually displayed during load — a composite measure of perceived speed.
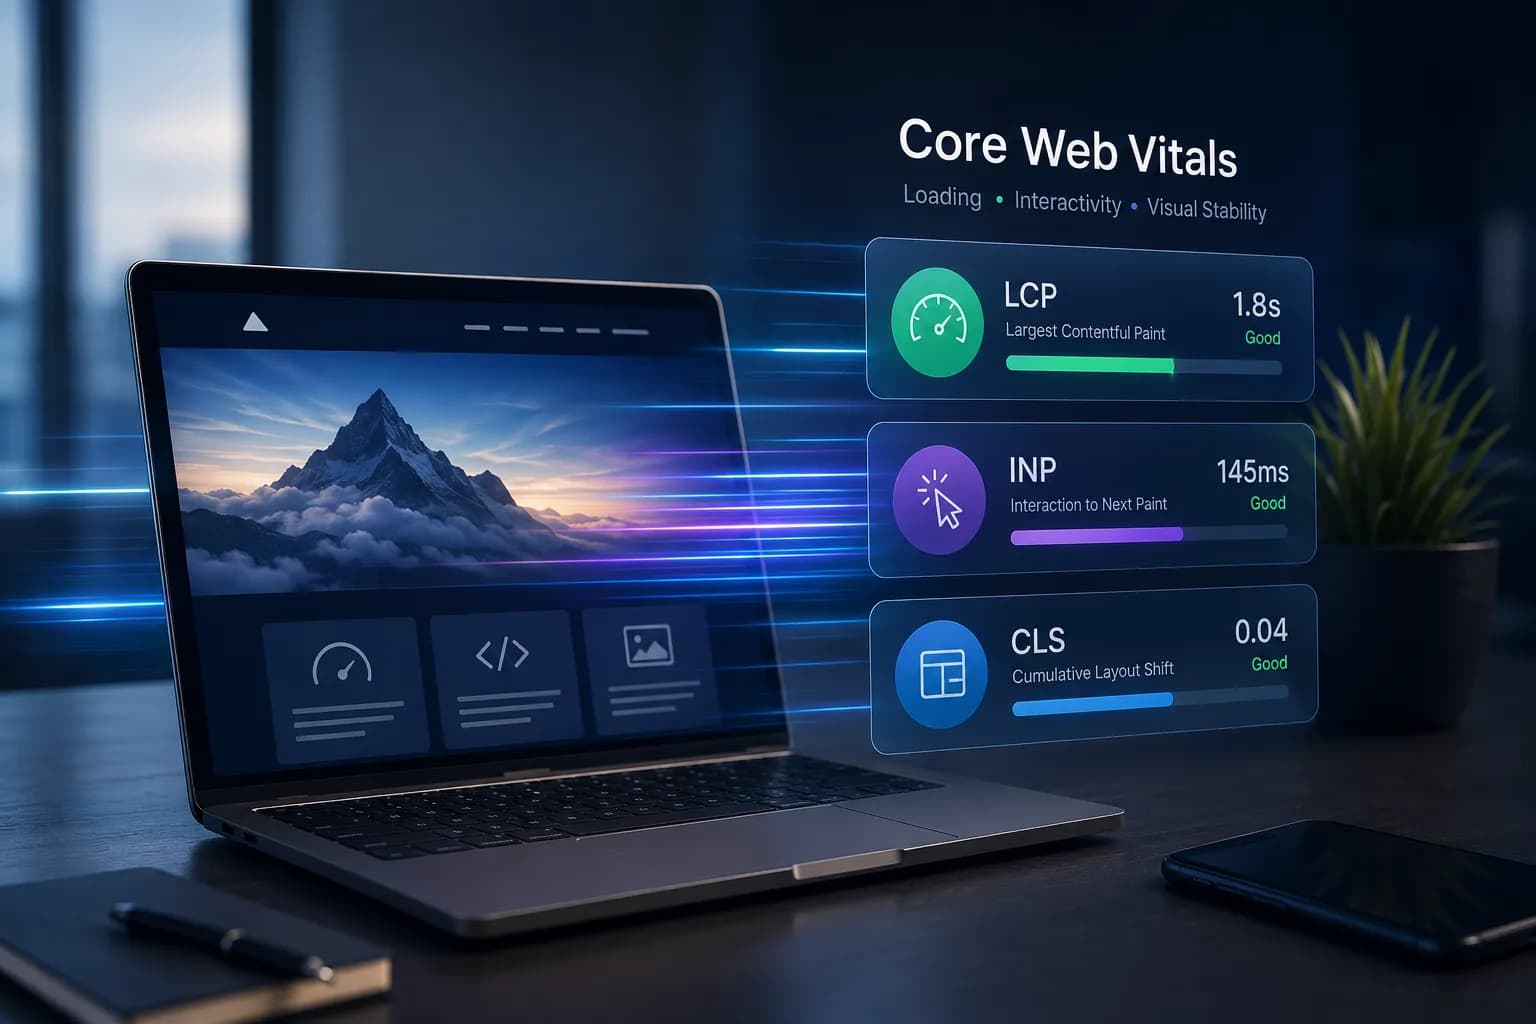
For a full explanation of LCP, INP, and CLS — including target values and fix strategies — see Core Web Vitals: what they are and why Google cares →
Lab data vs field data — the critical difference
PageSpeed Insights shows two types of data. Confusing them leads to wrong decisions.
Lighthouse simulation
Runs in a controlled environment: simulated mobile device, throttled 4G connection, clean browser cache. Gives you the 0–100 score and specific recommendations.
Use for: diagnosing problems, before/after comparisons, development testing.
CrUX — real user data
Collected from actual Chrome users who visited your site in the last 28 days. Shows the 75th percentile of LCP, INP, and CLS — no single score, just pass/fail per metric.
Use for: understanding real user experience, Google ranking signals, business impact.
Your lab score and field data can differ significantly
A site can score 95/100 in Lighthouse but show "Poor" INP in field data — because real users on slow devices and poor networks experience something the lab simulation does not capture. Always check both. Field data in Search Console is the ground truth for SEO impact.
Common misconceptions about the PageSpeed score
"Google ranks sites by PageSpeed score"
Not exactly. Google uses Core Web Vitals from real user data (CrUX) as a ranking signal — not the Lighthouse score directly. A site with 70/100 lab score but good field CWV can outrank a site with 95/100 lab score and poor field CWV.
"100/100 is the goal"
Chasing a perfect score often means removing functionality users need — live chat, analytics, personalisation. 90+ on mobile with good field Core Web Vitals is the practical target for business sites.
"The score changes every time I test — it's unreliable"
Normal. Network conditions, server load, and third-party script availability vary between runs. Run 3–4 tests and look at the median. For trends, use Search Console field data over weeks, not single tests.
"Desktop score is what matters"
No. Google uses mobile-first indexing. Your mobile score and mobile field CWV determine your ranking. Desktop 100/100 with mobile 40/100 means you rank based on 40.
How to read your PageSpeed report
When you run a test at pagespeed.web.dev, focus on these sections in order:
- 1Core Web Vitals assessment — pass or fail for LCP, INP, CLS (field data, if available)
- 2Performance score — the 0–100 number (lab data)
- 3Opportunities — ranked list of fixes with estimated time savings
- 4Diagnostics — additional context (TTFB, main-thread work, third-party impact)
Start with the top 3 Opportunities — they usually address 70–80% of the score gap. For a breakdown of the underlying causes, see 10 real reasons your website loads slowly →
What a good score looks like by site type
| Site type | Realistic mobile target | Notes |
|---|---|---|
| Marketing landing page | 90–100 | Minimal third-party scripts, static content |
| Corporate website | 85–95 | Some analytics and forms acceptable |
| WordPress blog | 75–90 | Depends heavily on theme and plugin count |
| E-commerce (WooCommerce) | 70–85 | Product images and cart JS add weight |
| SaaS / web app | 60–80 | Interactivity requirements limit raw score |
PageSpeed score and business impact
The score is not an abstract number — it correlates directly with revenue. Sites in the "Good" CWV range see measurably lower bounce rates and higher conversion rates.
The full picture: why 90% of businesses lose customers in the first 3 seconds →
// SINGULARITY EDGE STUDIO
We guarantee PageSpeed above 90/100
Every site we build is optimised for Core Web Vitals from day one — not patched after launch. If your existing site scores below 90 on mobile, our Speed Audit identifies exactly what to fix and in what order.
Website performance optimization → · Why WordPress is slow →
Get your real PageSpeed breakdown
Free Speed Audit: lab and field data, Core Web Vitals pass/fail, and a prioritised fix plan — not just a score.
Free Speed Audit →Conclusion
The PageSpeed score is a diagnostic starting point, not a final verdict. Understand the difference between lab simulation and real user data, focus on Core Web Vitals pass/fail, and fix the top Opportunities before chasing a perfect 100.
A mobile score above 90 with green field CWV is the target that actually moves rankings and conversions. Everything else is optimisation detail.
// TOPICS
Author
Singularity Edge Studio
Engineering studio for web and software — Plovdiv, Bulgaria. We build corporate sites, SaaS, e-commerce, and DevOps infrastructure with a focus on measurable outcomes.
// MORE ARTICLES
Why 90% of Businesses Lose Customers in the First 3 Seconds — and How to Stop It
A slow website costs thousands of euros per month in lost customers. Global statistics, user psychology, Core Web Vitals, the top 6 technical problems, and a concrete action plan.
SEOCore Web Vitals — What They Are and Why Google Cares
LCP, INP, and CLS — three metrics Google uses for ranking. How to check them, what affects scores, and how to improve speed on WordPress and modern sites.
SEOWhy Does My Website Load Slowly? 10 Real Reasons
Unoptimised images, heavy JavaScript, slow servers, missing cache, web fonts, third-party scripts, and more — the 10 most common causes of a slow website and how to fix each one.